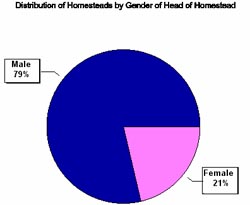
Exploration & description/Age and gender of headNext we must change the table to a vector so that the data contained in the table can be used as data to form a pie chart. This is done by right clicking 'gender' and selecting Convert in the menu that appears. We convert the table to a vector so that each column becomes a variable and also convert gender_1 to a text variable so that it can be used as a label in the pie chart. Click Spread → Set as Active Work Sheet to ensure that GenStat recognises this as the only active sheet and then click Graphics → Pie Chart.... Type '_counts' under 'Data values:' and enter 'gender_1' under 'Labels' to form the pie chart. The results show that heads were male in the majority (79%) of the homesteads and female in the remaining 21%.
|
![]()
![]()
![]()